Gold
- Ready to Roar Apr
5, 2010 9:21AM - by Howard Katz
Well,
it’s been a bad 5 months. Gold has mostly just gone back and
forth, and gold bugs are wringing their hands in frustration.
But this is the problem with using intuition in the markets.
One intuitively remembers the recent past, and one forgets
the larger picture. This is the big advantage of using charts.
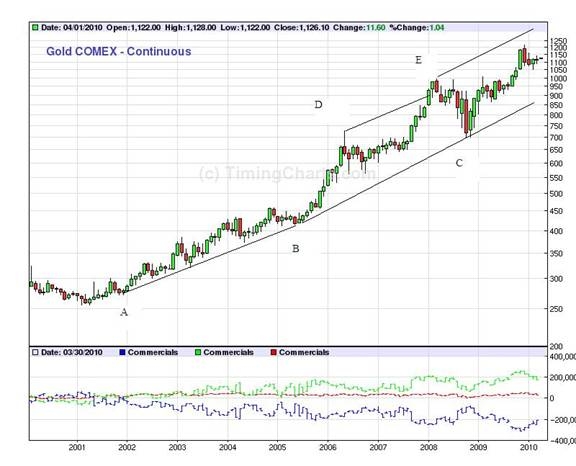
So let us look at a chart of this bull market going back to
its start in early 2001 just slightly above $250.
Well how about that gold bugs?
Gold has multiplied by more than 4 times over the past decade!
Viewed in the big picture gold has been steadily going up.
And how well has the typical establishment follower done over
the past decade? Well, we might take the S&P 500 as our
measure. Over the past decade, the S&P 500 has declined
by 25%. Now what would you prefer – 300% up or 25% down?
Of course, this is being too kind to the establishment.
The real establishment person did not follow the S&P.
The real establishment person followed the New York Times.
He faithfully obeyed the New York Times, and he does not even
know that the New York Times exists. (You see, the reporter
on his hometown paper faithfully echoes the opinions of the
Times, and so millions of Americans follow these opinions
without even knowing from whence they come.)
Well, what did the New York Times say over
the past decade? In 1999, they published the book, “Dow 36,000,”
by Glassman and Hassett predicting that the Dow Jones Averages
would go to 36,000 (from its then level of 10,000) in 4-6
years (i.e., between 2003 and 2005).
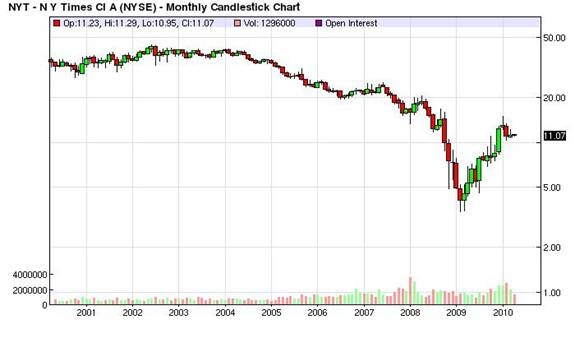
What the New York Times did over the past
decade was to buy their own stock early in the decade, when
it was near 40. After all, they are the greatest economists,
and their company is the greatest company. What could go wrong?
Now the New York Times stock is at 11, and a year ago it was
down to 4 – a 90% loss. They had to mortgage their new headquarters
and take a loan from Mexican billionaire, Carlos Slim.
So who was better off, the gold bug or the
establishment? The gold bug has 4 times as much wealth. He
lives in a fine house and has a lot more stuff. He is surrounded
by beautiful women. (Note to beautiful women. Gold bugs make
good catches as they can treat you in the manner to which
you would like to become accustomed.) On the other hand, if
you are an establishment follower, you can go to parties,
stick your nose in the air and pretend that you are one of
the elite. Since everyone else at the party has read the same
New York Times opinions, they will be struck by your great
wisdom, and when you prove disastrously wrong, they will quickly
erase that fact from their minds.
Going back to the chart of gold the chart
makes us recognize the big picture. And the big picture is
a gradual uptrend (which over the decade amounts to considerable).
This is crucially important, and it cannot be said too many
times: THE BIG MONEY IS MADE IN THE BIG MOVE. And yet we are
all sorely tempted to remember the small move (because it
is fresh in our minds). As you can see, the fluctuations of
the past 5 months are just a minor detail. Soon they will
give way to another up move (such as the rally of September,
October and November of last year). This will be followed
by another round of profit taking, etc.
One of the characteristics of the gold chart,
which strikes even the casual observer, is the steadiness
of the up trend. Chartists tend to be too mathematical and
like to draw precise lines. But you probably get a more honest
picture if you stand back and get an intuitive notion of the
trend. For example, I have drawn two trendlines, AB (from
2001 to 2005) and BC (from 2005-2008.) An up trendline is
drawn connecting two low points. To complete the picture,
we select a prominent high point and draw a line through it
parallel to the original trendline. Thus through D we draw
a line parallel to AB, and through E we draw a line parallel
to BC. These lines represent the top of the channel.
For example, when gold got above the line
through D in early 2008, this was a signal that gold was (temporarily)
too high. Together with other signals this allowed me to put
out a sell signal on March 7, 2008. In essence, when gold
is near the bottom of the channel (near the trendline), it
is a good time to buy. When gold is near the top of the channel,
it is a good time to step away and take profits. If you just
interpret the lines roughly, then they give you useful information,
and together with other signals you can get out close to an
intermediate high. It was the same type of thinking which
led to my sell signal (special bulletin) of Dec. 2, 2009.
Now with the decline from $1,229 and the passage of time,
gold has pulled back from the top of its channel.
A very important line (not drawn) extends
from point E through $1,000, horizontally through 2008-09.
This line was broken in October 2009 as gold moved above $1,000.
When a technical pattern makes such a breakout, it is normal
behavior to pull back to the break out point one last time
before making its real advance. Thus, my original expectation
(after the Dec. 2009 top) was for a pull back to $1,000.
But I argue in the April 2, 2010 issue of
the One-handed Economist that this is one of those rare exceptions
where the pull back does not go all the way to the breakout
point, that the intermediate bottom has been made (at $1,050,
not $1,000) and that we are ready for another leg up. Thus,
I expect the gap between $1,050 and $1,000 to remain open,
and this is such an unusual event that it must be regarded
as a very powerful (in this case bullish) signal. The final
proof that the gap has remained open will be a move in gold
above the Dec. top at $1,229, and this event (together with
the break above $1,000 back in October) will be a second signal
that gold is in a massive, long term bull move.
In other words, dear gold bug, you ain’t hardly
seen nothing yet.
Another very exciting fact, which supports
the bullish argument above, is the sharp drop in bonds which
occurred near the end of March. It makes the bond chart look
like a developing head and shoulders top. This top has not
yet broken down (which will occur on a break below 112). But
if it does break down, the implications are awesome.
You see, bonds and commodities traditionally
move opposite to each other. There are a few exceptions to
this. Say that bonds and commodities move opposite on the
major term but differ from this pattern to signal a grand
cycle move. For example, in 1972, as commodities were just
getting started on their grand cycle upswing bonds were flat
for a year as commodities moved up. This ability of commodities
to outperform inverse bonds foreshadowed a very powerful rise
in commodities, which occurred in 1973-74. During this time
gold moved from $65 to $196. Conversely in 1981 commodities
dropped sharply in the face of a continued fall in bonds,
and this signaled the grand cycle drop in commodities of the
1980s and ‘90s.
Thus far, commodities have moved aggressively
higher in the face of a flat bond market (2003-10). If we
now get a declining bond market, commodities should explode,
as they did in 1973-74.
What these considerations are telling us is
that all the fundamental information which has been coming
in since 1981 about the mismanagement of the U.S. economy
is correct. It is merely that there is a long time between
cause and effect. Ronald Reagan doubled the U.S. money supply.
Bush Sr. and Jr. kept on printing money. The Treasury bill
rate went from 16% to 0%. All of these distortions have to
have their effect. Well, the bill has come due, and – as Ayn
Rand predicted – it is marked “ACCOUNT OVERDRAWN”
The vast majority of people do not understand
what is happening. The printing of money is a counterfeiting
racket run against them by their own government. To avoid
being robbed, they must be in gold. This is why every organ
of establishment opinion denounces gold and tries to scare
you away from it. If you value your hard earned wealth, do
not listen to them
You have made your way in the world by specializing
and becoming very good in one specific area. You then trade
your expertise, via the use of money, I too specialize, but
my specialty is the field of economics – monetary economics.
Now is a time when we need each other. I understand the cause
and effect relations when our own government depreciates its
currency, and I can see these effects working themselves out
in the markets in the real world.
What I have to offer you is my fortnightly
(every two weeks) newsletter analyzing the financial markets
with special attention to the precious metals. When the dollar
goes down, gold goes up. When the dollar goes up, it’s just
a short term move because, in the days of Barack Obama, dollars
pretty much do grow on trees.